
Splits Analytics breaks a race into its splits and reads them four ways: pacing, PR comparison, fatigue trend, and a goal engine. Pick the event and the race, then walk the tabs. It works for every distance, 50 through 1500.
What Splits Analytics shows you
A final time says what happened. The splits say how. Splits Analytics takes the official splits from a race, no manual entry, and turns them into four views, each answering a different question about the same swim.
Pacing shows how the race was swum. PR vs Race shows what changed from the best. Fatigue tracks endurance over years. The Goal Engine works out where the next seconds are most likely to come from.
Step by step
Open Splits Analytics
In the menu, go to Analysis, then Splits Analytics.
Pick the event and the race
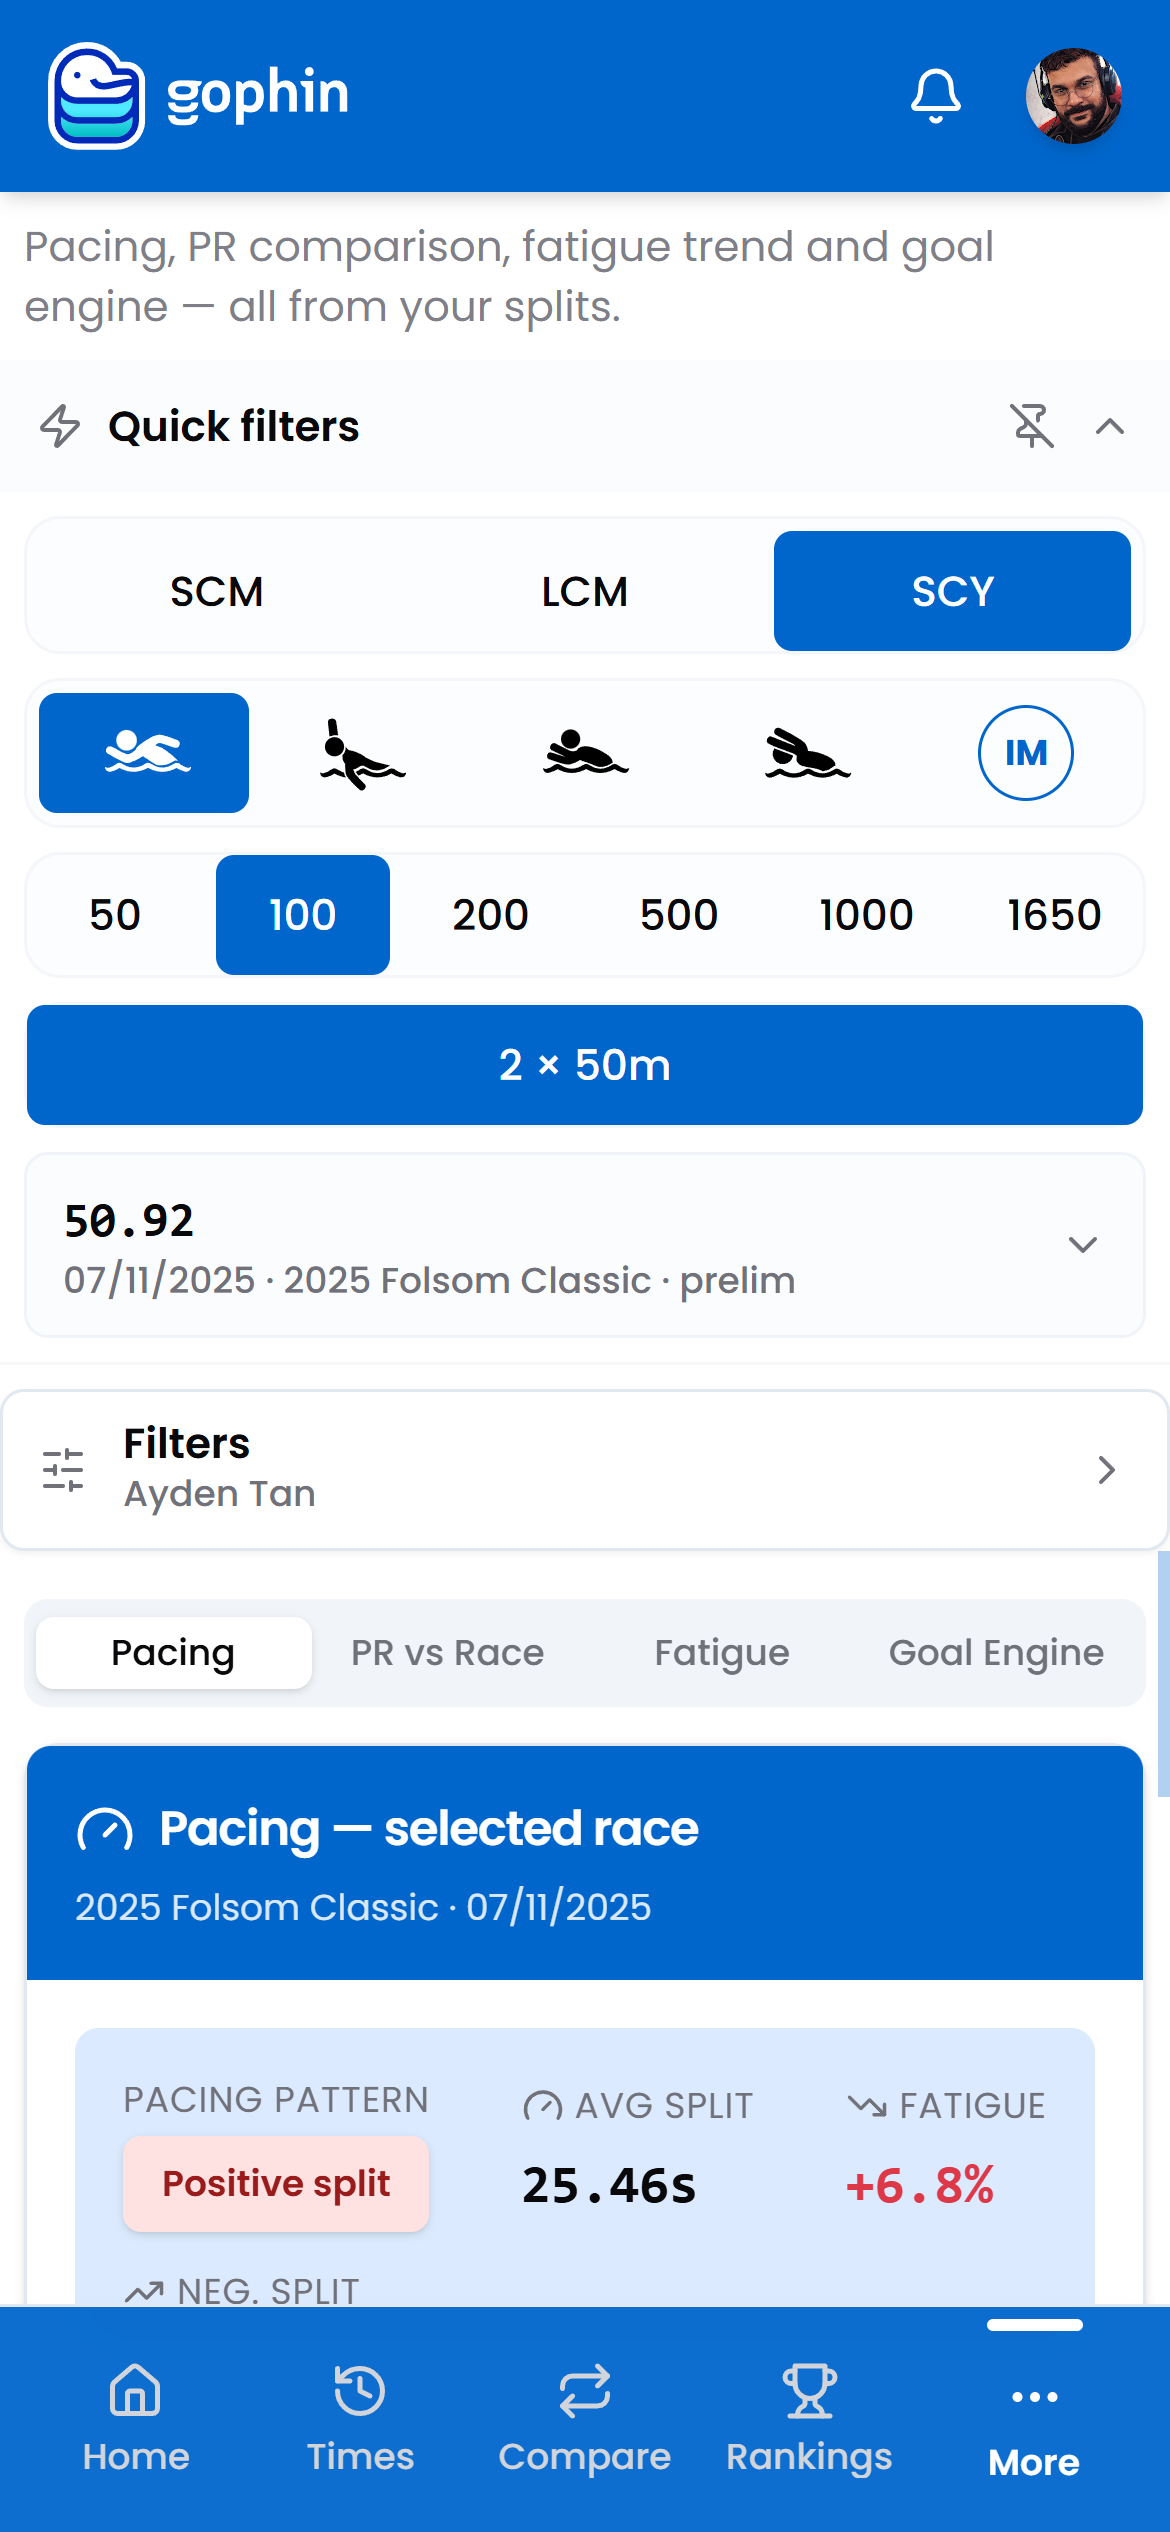
Set the course, stroke, and distance in the quick filters, then choose the race. Only races where the meet recorded splits appear.
Read the Pacing tab
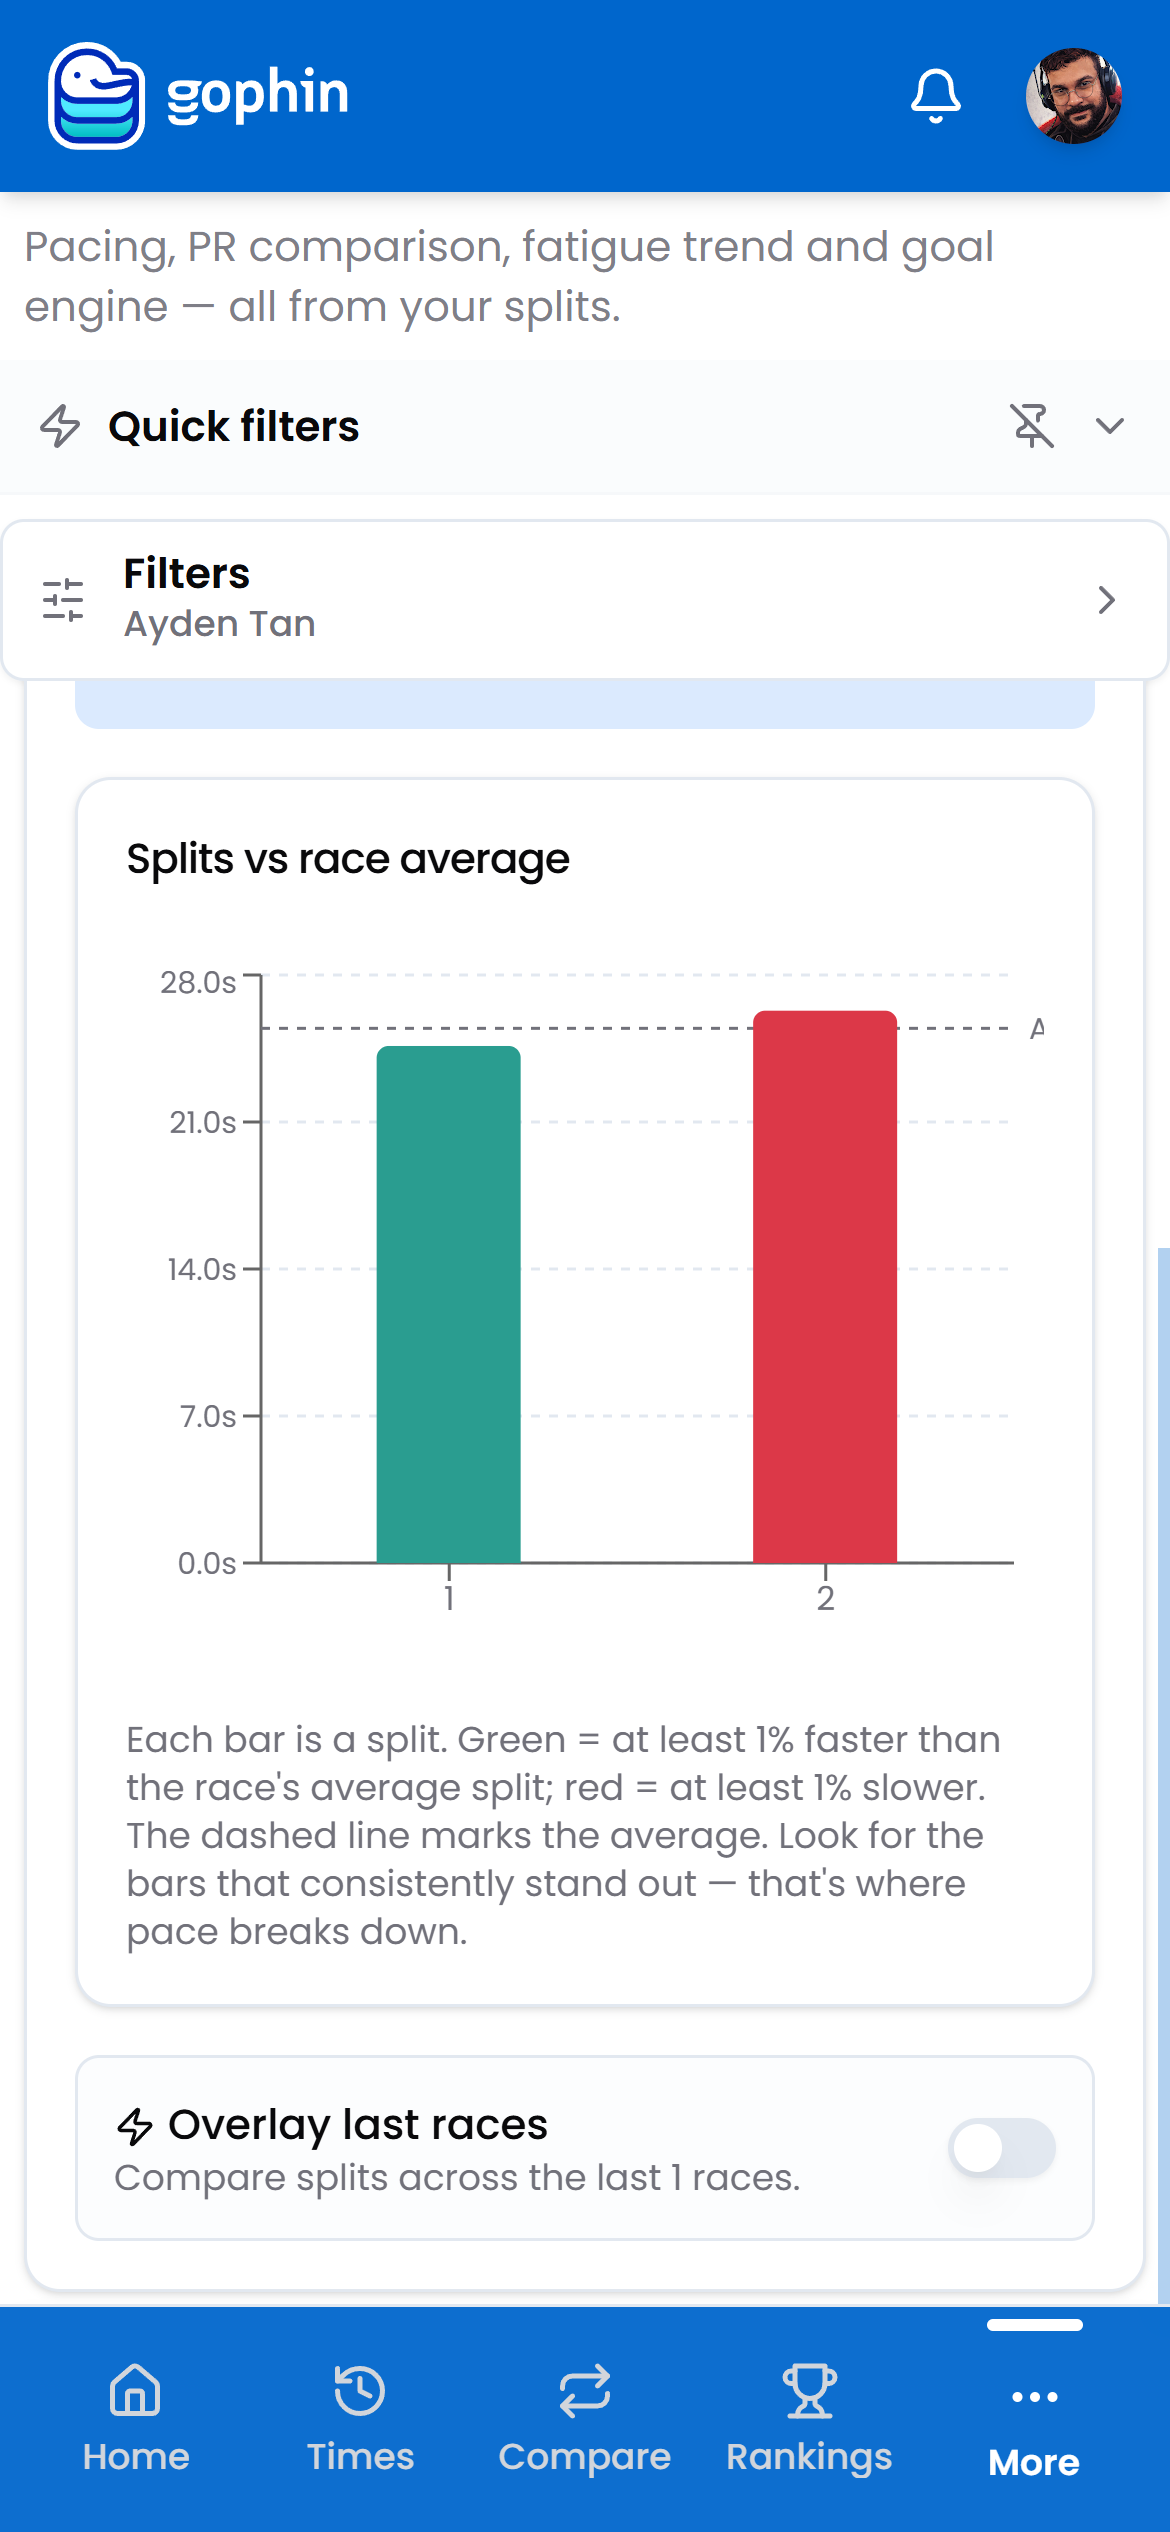
Each bar is a split, measured against the race’s own average. Green is faster than average, red is slower. The label calls the pattern: positive split (faster first half) or negative split. Toggle Overlay last races to see if the pattern is a habit.
Compare with the PR
The PR vs Race tab lines this race’s splits against the personal best, split by split, and shows exactly where time was gained or lost.
Check the Fatigue trend
The Fatigue tab tracks how much a swimmer slows in the back half, race by race, across seasons. A downward trend means endurance is building.
Set a target in the Goal Engine
Pick a target time. The Goal Engine compares each split against real swimmers of the same age range and shows the weakest one. Drag the simulator to test where the seconds should come from.
What's included
What's included
All four views work for every distance, 50 through 1500, and let you stack up to 3 swimmers side by side in the same view.
Tips
- No splits in the list? Some meets do not record them. Try another race or distance.
- Read the pattern label first. Positive or negative split is the headline of the race.
- Trust the trend over one swim. One red bar is a race; a repeated red bar is a habit.
- The weakest split is often a surprise. A fading finish can actually be a slow start, the benchmark tells you which.
Common questions
What can I see in Splits Analytics?
All four views, Pacing, PR vs Race, Fatigue, and the Goal Engine, work for every distance from 50 to 1500, and let you stack up to 3 swimmers side by side.
Where do the splits come from? Do I enter them?
No manual entry. Splits Analytics pulls the official splits recorded for the race and turns them into the four views automatically. If a meet did not record splits, that race simply will not appear.
What is the difference between a positive and a negative split?
A positive split means the first half was faster than the second. A negative split means the swimmer finished faster than they started. The Pacing tab labels the pattern for you so you can read the race at a glance.